Domain Adaptation
Transfer learning is a widely adopted technique in deep learning. It involves using the weights of a pre-trained model to drastically reduce the time and costs of training a new model. One subcategory of transfer learning is domain adaptation, which refers to improving a model on a dataset that differs from the dataset on which it was trained. This means narrowing the differences between two datasets, also known as domain gaps, that hinder the model’s performance on the new dataset. It is critical to minimize these domain gaps in order to achieve comparable levels of performance on both datasets.
Most often, minimizing domain gaps is a manually intensive task requiring large amounts of coding, research, and data science expertise. The work involved in identifying and addressing domain gaps is specific to a particular model and dataset. It may take weeks, or even months, of programming to extract the necessary insights and gather the information needed to discover and fix these gaps.
This article illustrates how the domain gap between two automotive datasets on the same model can be resolved with minimal time and effort using Tensorleap’s platform. While these gaps can occur in any domain, they are particularly relevant for the automotive domain, where landscape, climate, and a variety of other factors vary across different geographies and datasets.
Identifying the Domain Gap
In domain adaptation, the latent space is the most critical factor in finding domain gaps, because the automatic extraction of the latent space helps to quickly identify differences between the datasets.
Rather than manually creating a latent space, the model was imported into the Tensorleap platform along with the two datasets: the dataset that the model was trained on, known as the source data set, and the data set that we want to improve the model’s performance on, known as the target dataset, as follows:
- Semantic Segmentation Model: DeepLabV3Plus
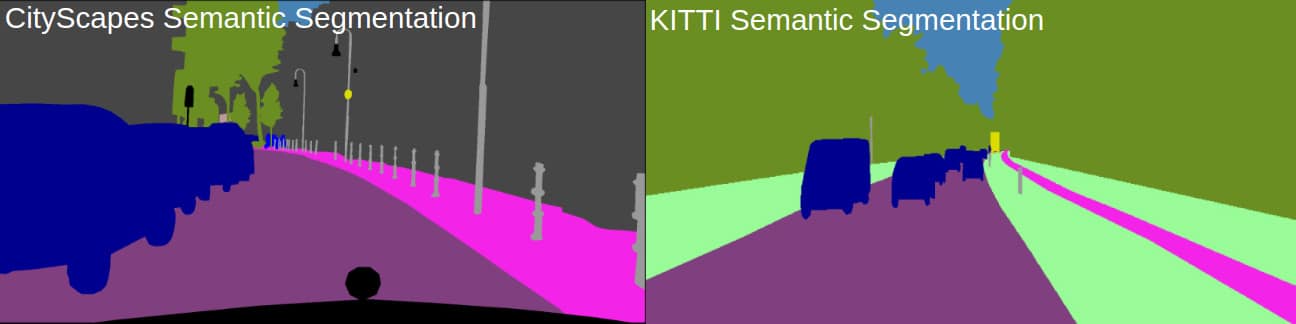
- Source Dataset: Cityscapes semantic segmentation data on which the network was trained. Note that the Cityscapes dataset used here, was taken from two cities: Aschen and Zurich.
- Target Dataset: Semantic segmentation KITTI dataset.
Creating a Latent Space
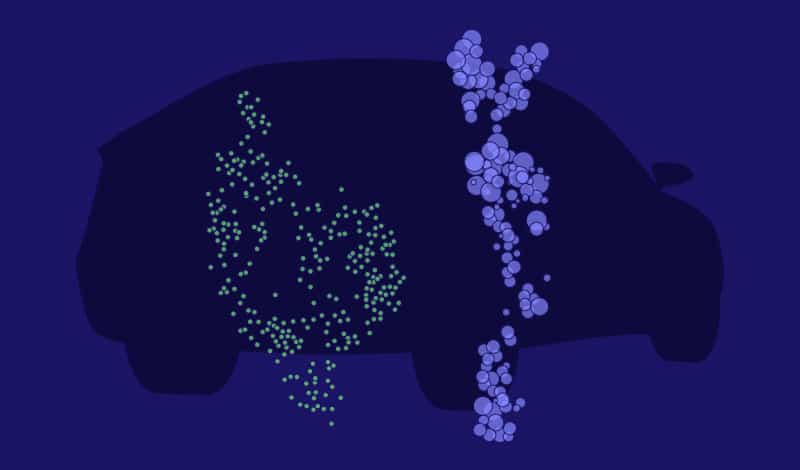
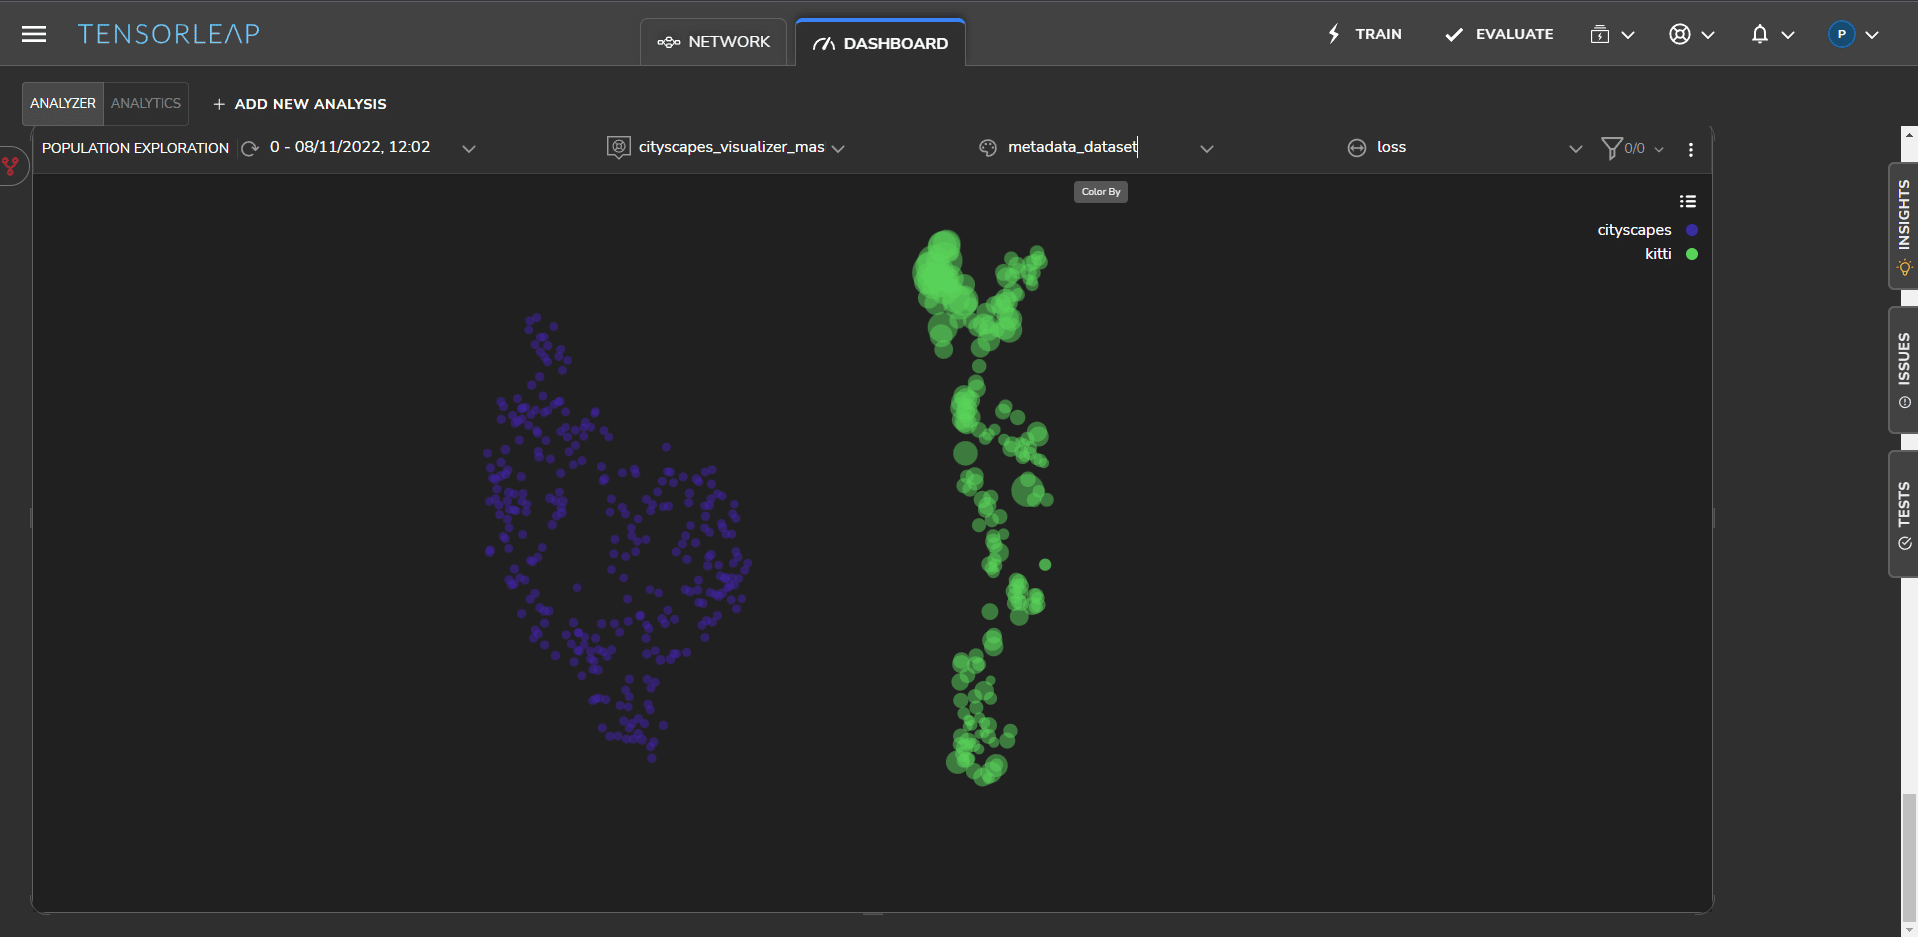
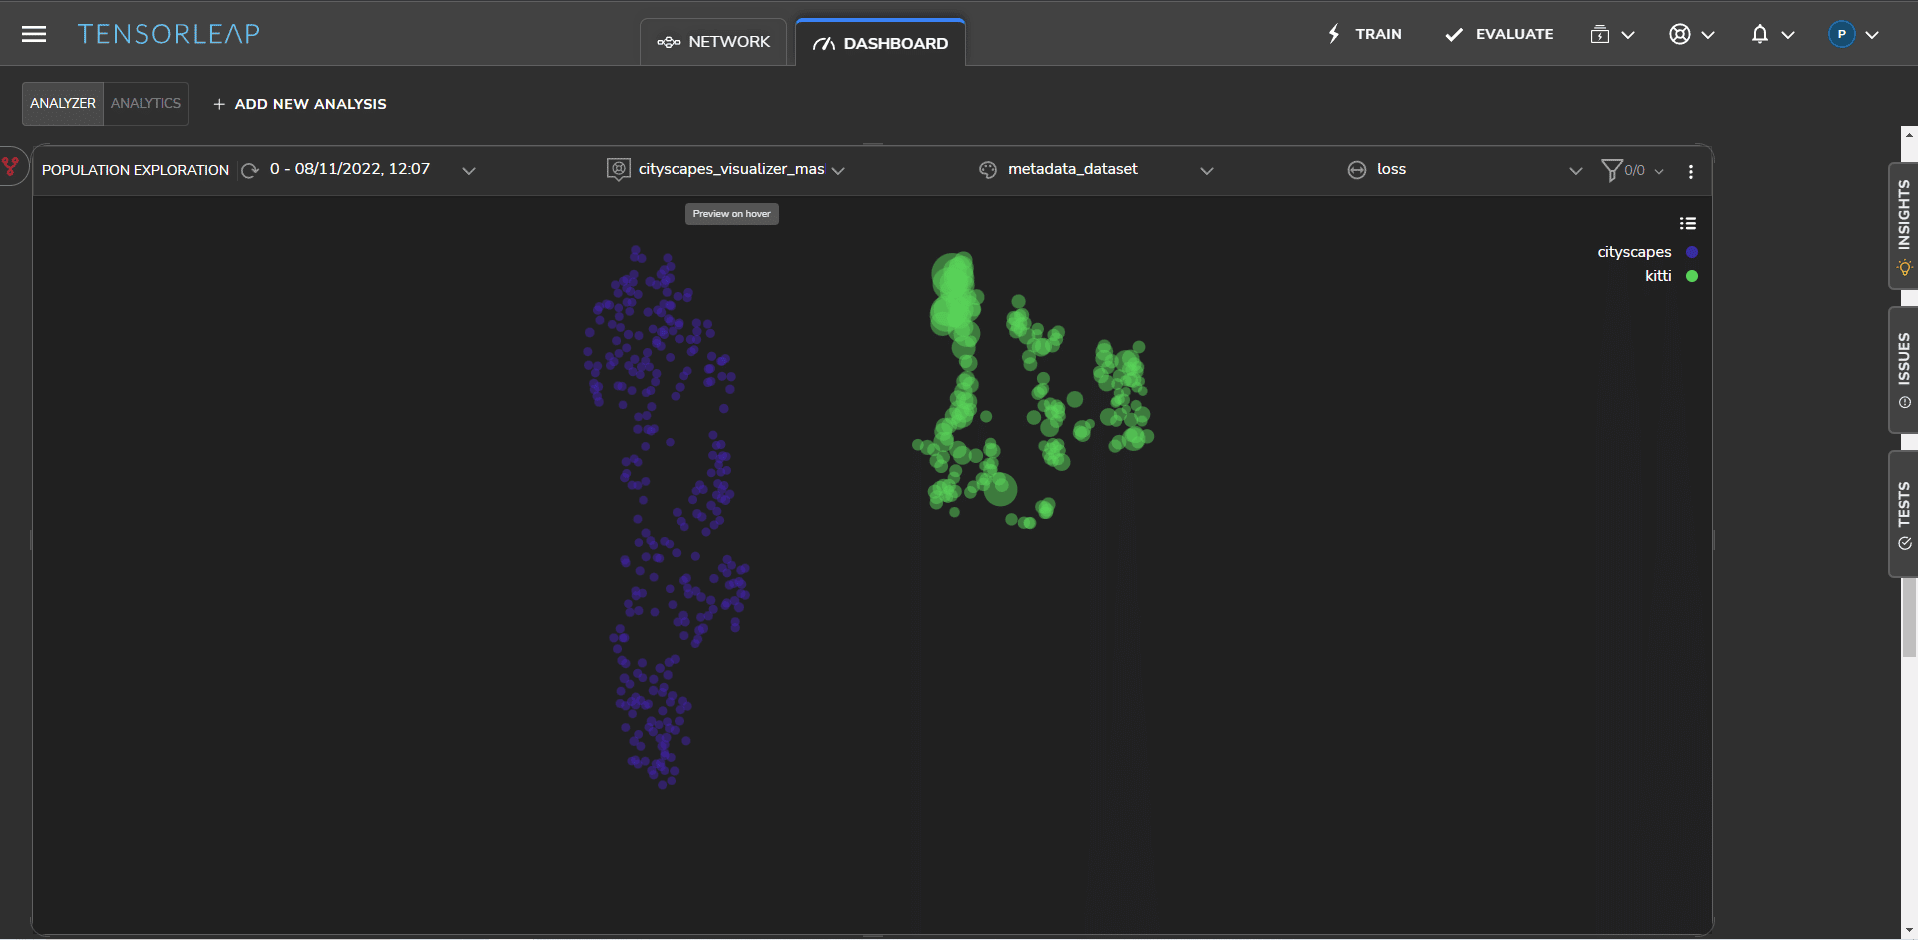
Tensorleap automatically extracts an optimal latent space for the model enabling you to view a visualization of the two datasets. Figure 2 below shows the datasets as two separate clusters – Cityscapes in red and KITTI in green.
The space between the datasets in the latent space is the visual representation of the domain gap and the difference in their distributions. In this visualization, the loss is reflected in the size of the sample within the cluster. A higher loss is represented by a bigger radius. As expected, Figure 2 shows that Cityscapes, the source data set, has narrower samples and is therefore performing far better than KITTI.
Measuring Model Average Loss
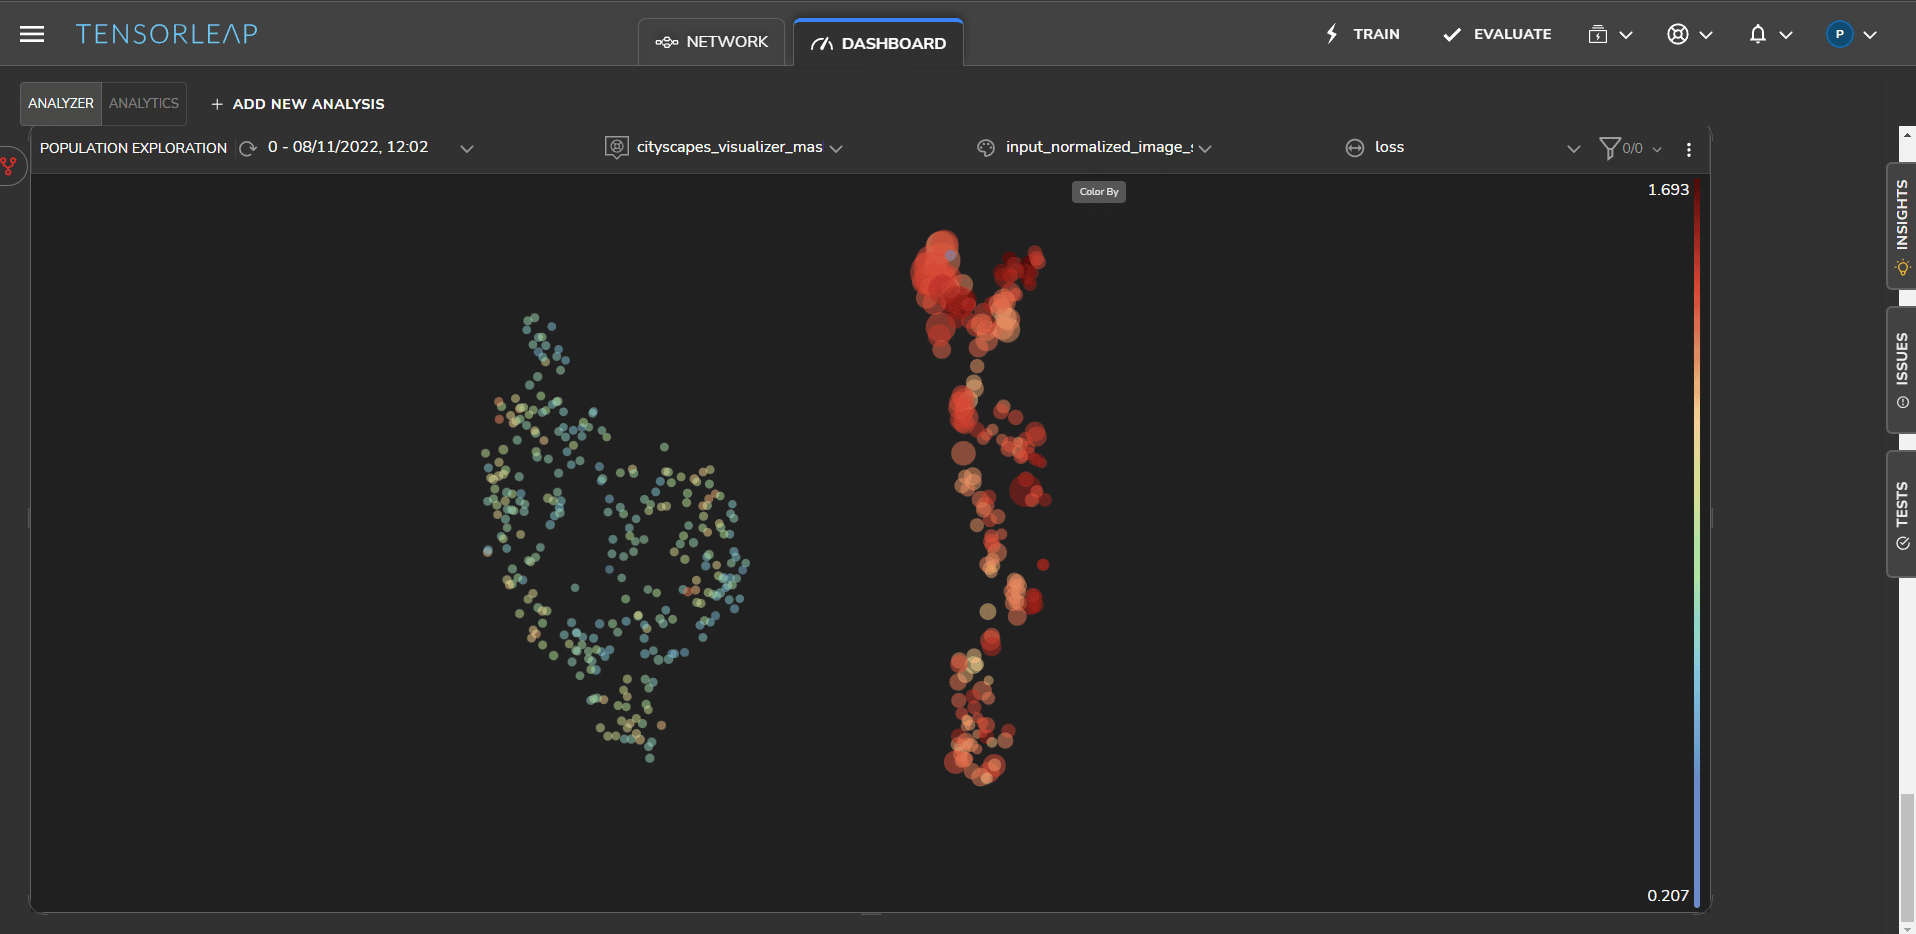
To further understand the domain gap, we assess the average loss across the whole model for each dataset. Figure 3 shows a visual representation of the model’s average loss for both Cityscapes (left) and KITTI (right).

Here too the visualization shows a much lower loss for the Cityscapes dataset, compared with the KITTI data set.
Root Cause Analysis of a Domain Gap
Now that we have established that a domain gap exists, we need to understand the root cause in order to minimize the gap.
Equipped with an informative latent space along with multiple Tensorleap analysis tools, we begin to identify the reason for the loss.
The first step involves comparing samples with the highest loss to find common traits that may be the reason for the error. We can do this by simply viewing the samples with high loss or through heatmaps.
In this exercise, we found three possible causes for the domain gap: color mismatch across the entire data set, variations in the roadside landscape, and color mismatch specific to the sky. We will explore each of these causes in the following sections.
Domain Gap – Color Mismatch
To test for color variations across both datasets, we analyzed the distributions according to their RGB standard deviation. Figure 4 illustrates the samples according to the RGB standard deviation – the samples with a higher deviation are shown in red.
Evidently, the standard deviation in the KITTI dataset is higher than the Cityscapes samples, as most of the samples in the KITTI cluster (right side) are red. This shows that color is definitely an issue.
The platform enables us to view samples of each dataset for any obvious differences. Placing our cursor on the samples with the highest loss, as shown in Figure 2, we can immediately view apparent differences between the images in both clusters. Figure 5 below shows a sample from both datasets KITTI (top) and Cityscape (bottom).
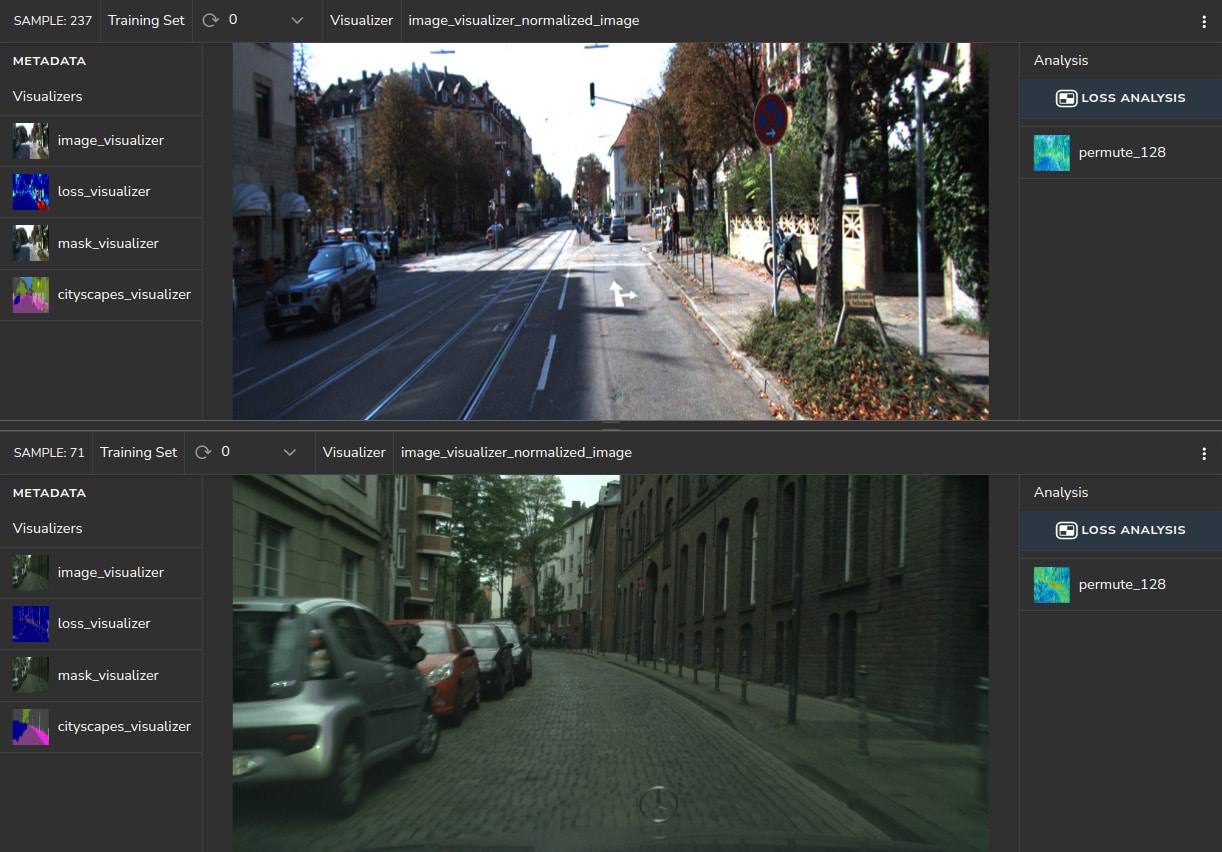
The Cityscapes, shown at the bottom, has a greenish hue compared to the KITTI sample shown above it. This is a direct result of the difference in the image signal processing (ISP) pipeline of the two measuring setups.
To solve this color scale problem, we can normalize the RGB channels of both datasets so that the dataset distributions will share the same mean and standard deviation. This modification resulted in a large reduction in the model’s loss on the KITTI dataset. Figure 6 below shows both datasets after the normalization. The distribution of samples in the latent space has changed and is now more informative.
Furthermore, the average loss for the model, shown in Figure 7, has decreased by 23%. We see this change by comparing the loss the model had before and after the color normalization.
Domain Gap – Roadside Vegetation
Tensorleap generates automatic insights into areas that may require further analysis. Figure 8 shows a cluster detected by the platform with a very high loss.
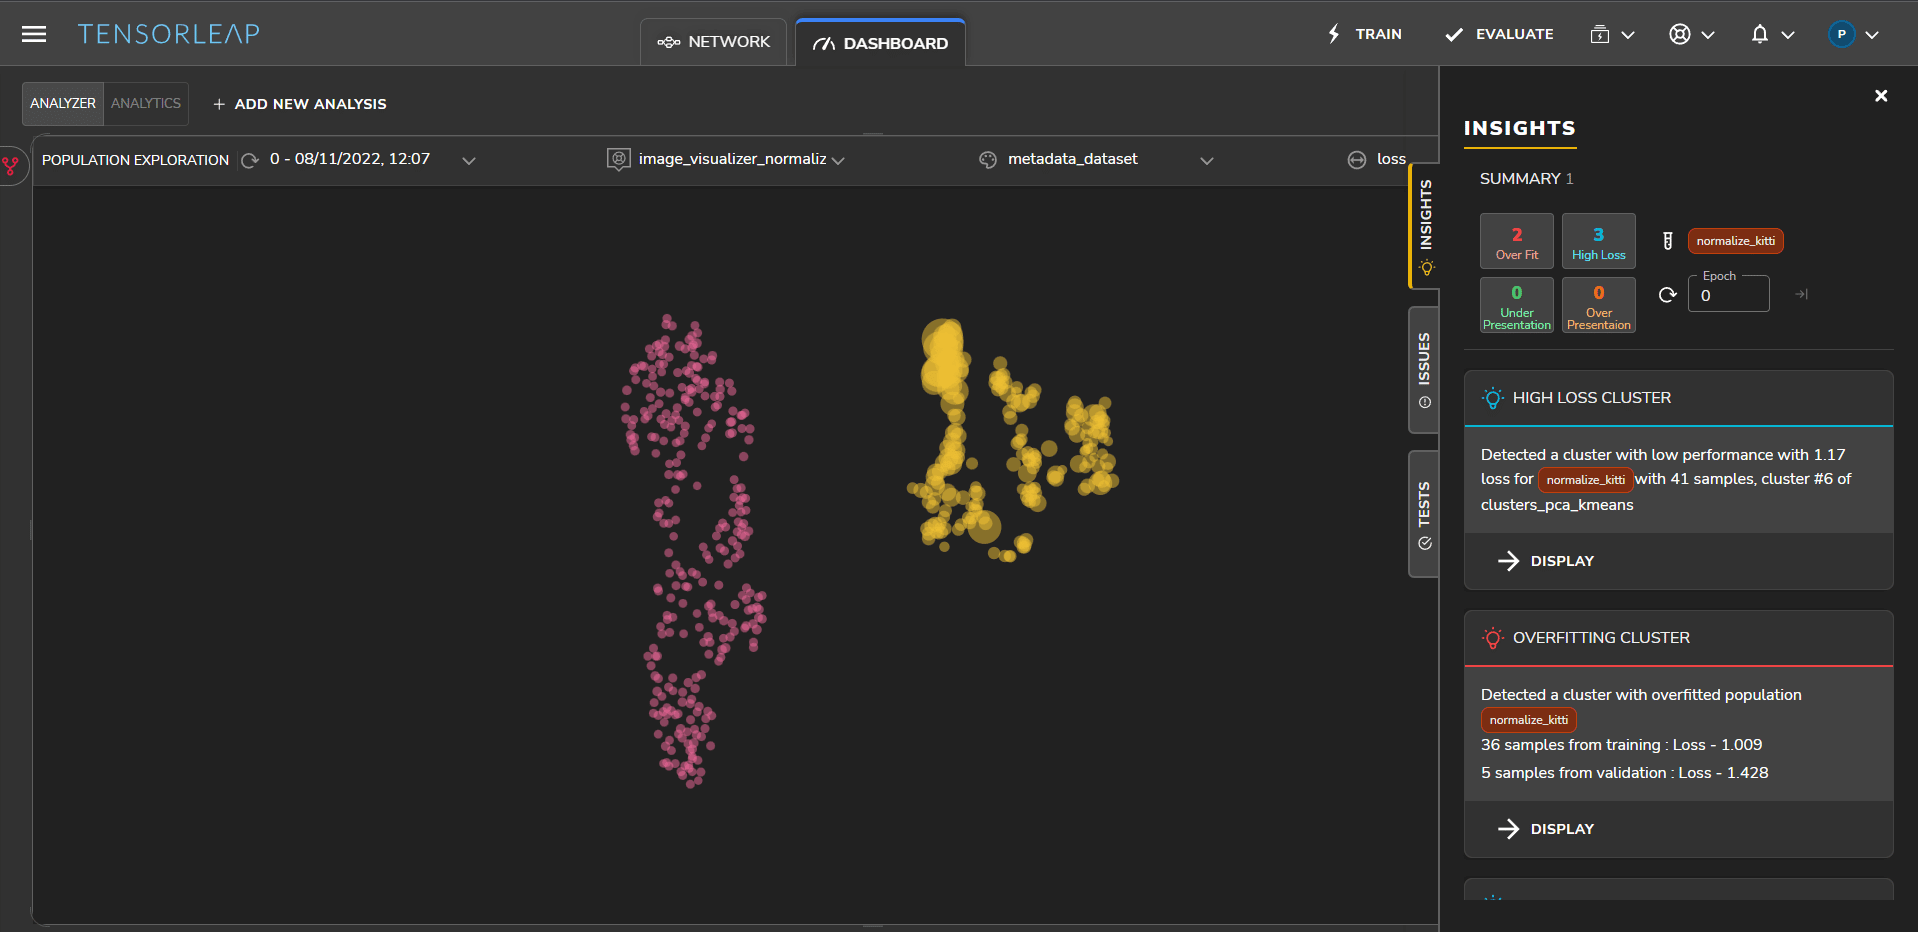
We can identify the source of the issues by studying the samples of the problematic cluster, as shown in Figure 9. All samples contain roadside vegetation.
Heatmaps help us identify which regions in the image have a higher loss, as shown in Figure 10.
The heatmaps indicate that the roadside region (marked in red) has a high loss. For some reason, the model is unable to correctly segment the roadside vegetation in the KITTI dataset.
Using the platform dashboards, we can evaluate if there is a statistical connection with the vegetation class by seeing if there is a relationship between the amount of vegetation and loss levels.
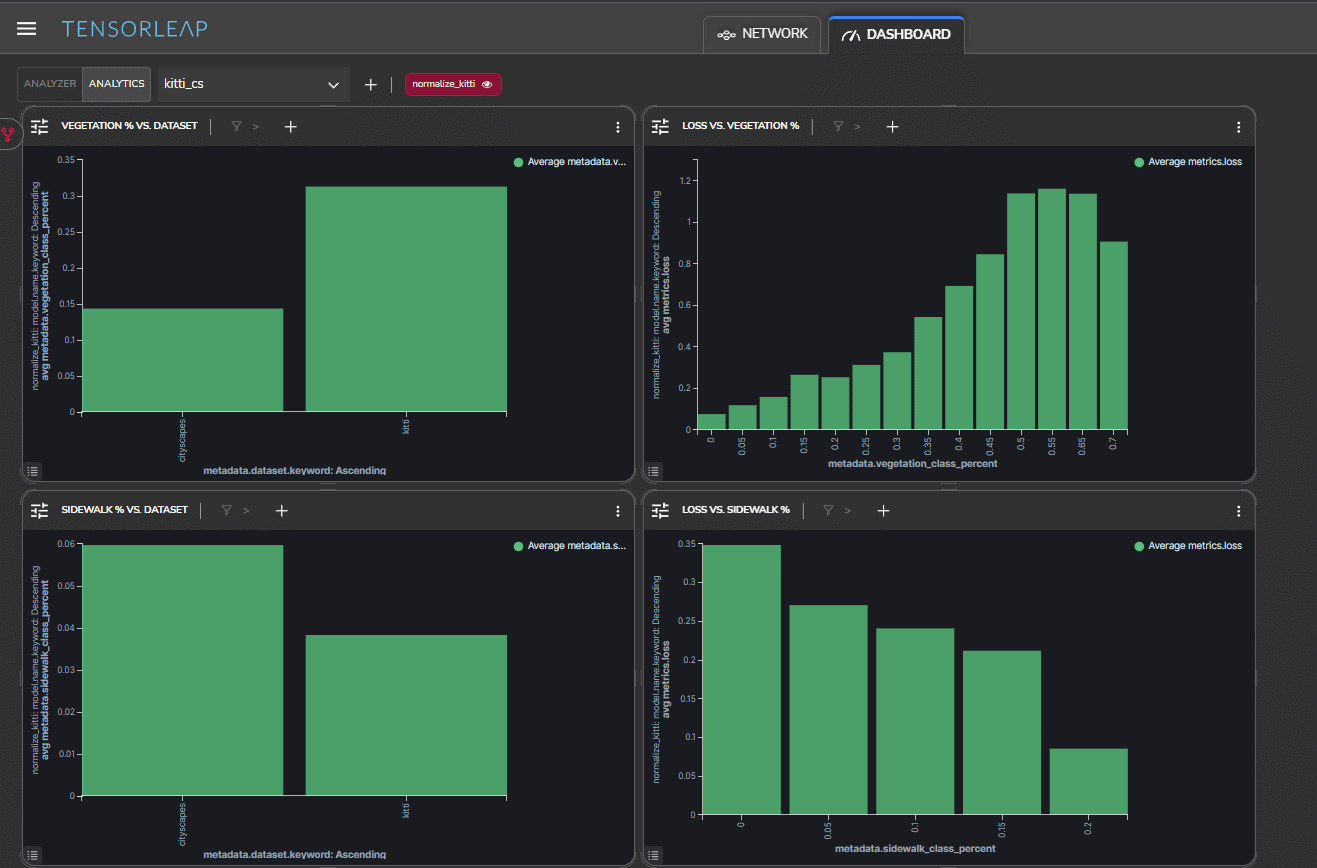
The top left quadrant of Figure 11 shows that the KITTI samples have more vegetation pixels. The top right quadrant shows that the more vegetation pixels present in a sample, the higher the loss.
As we are focused on the roadside, we can also study sidewalk statistics. The bottom left quadrant of Figure 11 shows that the Cityscapes samples have more sidewalk pixels. The bottom right quadrant shows that the more sidewalk pixels a sample has, the lower the loss.
We can now build a hypothesis for these correlations and loss maps. The Cityscapes dataset, on which the model was trained, is significantly more urban, with sceneries consisting largely of city photos and pavements. As a result, the model does not perform effectively on rural roads. This domain gap can be solved by fine-tuning erroneous samples or increasing their weight during the model’s training.
Domain Gap – Sky
The dashboard and the platform’s visualization tools identified the sky color as a possible root cause for the loss. However, the color normalization performed earlier to mitigate the color scale domain gap resolved that issue.
Figure 12 shows the Intersection Over Union of the sky semantic class before and after the color normalization. One possible explanation for this is that the sky class is predominantly composed of color-based features (that don’t have a lot of structure) and as a result is affected by the color-scale change.
To visually see the decrease in the error for images that contain a high percentage of sky, we can perform error analysis on the same sample, before and after the color normalization change, as shown in Figure 13.
The KITTI sample at the bottom shows loss across numerous sky pixels before the normalization. The image at the top shows the sky after color normalization. A before-and-after comparison enables you to see the effect of each change on model performance.
In Summary
The work involved in identifying and addressing domain gaps can be extremely time-consuming. It may take weeks, or even months, to create an informative latent space that can be used to identify and resolve the gaps. Even then the work will have to be repeated for the next model.
The Tensorleap platform provides an advanced set of tools and features that help data scientists improve their data models and narrow domain gaps. In this article, we have seen how the automatic generation of an optimal latent space, along with numerous analytic tools, dashboards, and insights, enabled us to rapidly identify and minimize three domain gaps between ADAS datasets. Such an exercise, which could take months of manual programming work, was achieved in a matter of hours using the Tensorleap platform.